STATSCORE Dotmap – Perfect Way to Visualize Key Match Events
A final score tells you who won, but it rarely reveals how the game was played. STATSCORE Dotmap changes that by putting every key moment – goals, shots, free kicks, offsides, and more – directly on a visual pitch.
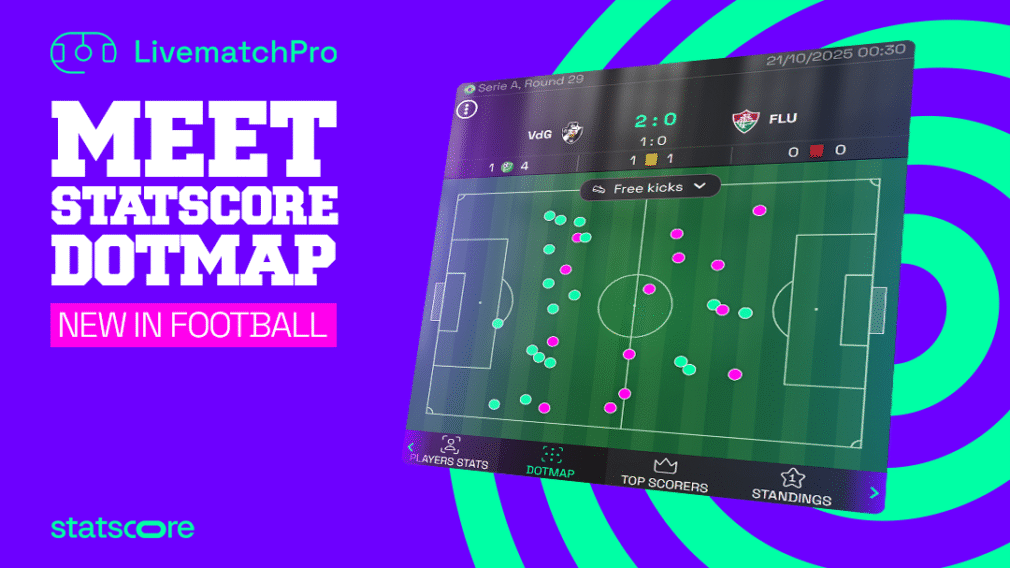
This allows sports fans and bettors to instantly grasp the flow, turning match data into a clear, interactive story. Now part of STATSCORE LivematchPro, Dotmap brings advanced analytics to fans, media, and sportsbooks alike.
Visualize Every Critical Moment
Dotmap provides a detailed, granular view of football matches by mapping key events, offering spatial context for attacking threats, defensive actions, and tactical execution.
Each incident is precisely placed on a field visualization, making it immediately clear where the game was controlled, won, or lost.
The tracked events include:
- Goal: pinpointing exactly where the ball found the net.
- Shot on target: attempts that tested the goalkeeper or required a save.
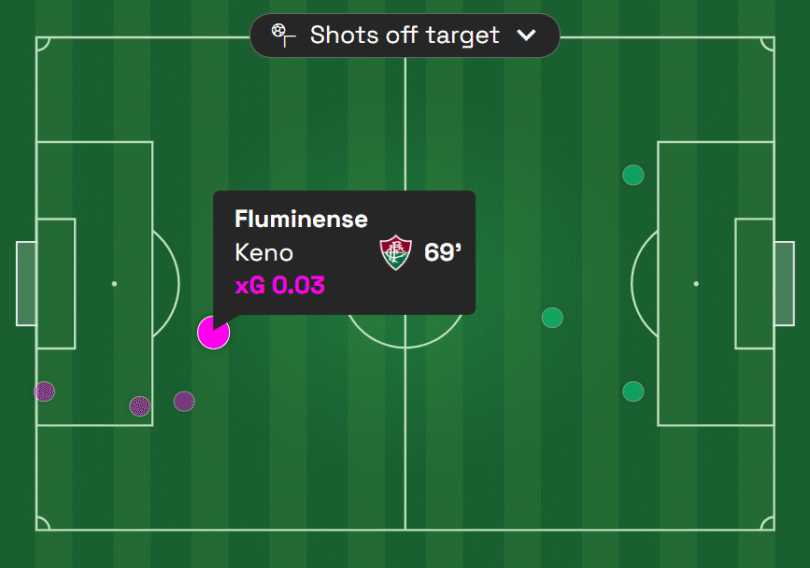
- Shot off target: missed opportunities that highlight what might have been.
- Blocked shot: showing the location of shots stopped by the opposition.
- Free kick: visualizing set-piece chances that can change the game.
- Offside: indicating tactical discipline – or lapses – in positioning.
Each dot also carries detailed contextual information, including the team, player (when available), and the exact timing of the event.
For goals and shots, xG (expected goals) values are displayed when available, providing an advanced measure of scoring opportunity quality. This goes beyond simple shot counts, showing not just that a shot was taken, but how likely it was to result in a goal – whether from a cross, through ball, or other play.
Broadening the Impact: Benefits for Sports Businesses
Dotmap’s combination of spatial visualization and rich contextual data provides significant value for sports media, sportsbooks, and fans alike.
For Sports Media
Dotmap is a powerful tool for commentators, pundits, and journalists, enhancing coverage in several ways:
- Enhanced reporting: Broadcasters can integrate Dotmap to show real-time spatial context for goals and major events, giving viewers a deeper, analytical understanding of the game.
- Elevated commentary: Pundits can reference the precise locations of missed chances, blocked shots, or dangerous free kicks, turning subjective opinion into data-backed insights.
- Advanced post-match storytelling: Journalists can use Dotmap graphics as the centerpiece of articles, visually summarizing why xG values were high or low and highlighting tactical strengths or weaknesses.
For Sportsbooks
The precision and spatial context of Dotmap make it invaluable for live (in-play) betting:
- Boosting engagement: Dotmap instantly visualizes momentum and threat areas, converting passive viewers into active, confident bettors.
- Increasing revenue: Advanced prop bets (e.g., a specific player taking more than 2.5 shots on target in the second half) are easier to support and promote.
- User retention: Advanced, transparent data positions the platform as the analytical choice, offering post-match validation and fostering long-term loyalty.
In essence, Dotmap represents a major evolution in football analysis. By transforming raw numbers into actionable, visual narratives, it empowers clubs, media, bettors, and fans to engage with the beautiful game in a smarter, more data-driven way.
Learn more about this feature at https://www.statscore.com/news-center/livematchpro/meet-statscore-dotmap-visualizing-goals-shots-and-key-football-events/.
Recommended